Wednesday, December 1, 2010

Forecasting with Bills of Material

Start of Content Area

Forecasting with Bills of Material  Locate the document in its SAP Library structure

Purpose

You can forecast dependent requirements in Demand Planning. The system determines the component parts of finished products through the production process model (PPM) or the production data structure(PDS).
This can be useful if material components represent practical constraints on the forecast at finished product level; that is, the available quantity of components is fixed but they can be used in different finished products. This situation arises in, for example, the chemical industry. The planner can immediately see the impact of the product forecast on the fixed component level.
This process can also be used in the consumer products industry to model a store display consisting of multiple products from one vendor. Both the display (the finished product) and the individual products (planned in Demand Planning as components) are released to Supply Network Planning.
In other industries, such as automotive part suppliers, actual demand occurs only at the component level while the finished product (for example, the car) has the role of making the part suppliers' forecast more transparent. For example, if one cassette box is built into each car, and it is known that 1000 cars will be manufactured, then the forecast for cassette boxes is also 1000. Demand for the finished product is not released to Supply Network Planning. The DP PPM/PDS allows you to model this situation.

Process Flow

...
       1.      Create and activate a production process model (PPM) with usage D (BOM Demand Planning) or usage S (PPM Supply Network Planning). There are the following methods to create a PPM for use in Demand Planning
·         You can create and activate a PPM for Demand Planning manually (see Creation of PPMs for Use in Demand Planning).
·         You can generate a DP PPM from an SNP or PP/DS PPM automatically. For more details, see Automatically Generating PPMs for Demand Planning. In this case, you can skip steps 2 and 3.
·         You create a PPM for Supply Network Planning either manually or by converting a PP/DS PPM that was transferred from R/3 into an SNP PPM. For more details, see Generating SNP PPMs from PP/DS PPMs.
Note
SAP recommends that for this process you use single-level PPMs; that is, PPMs where all components for the finished product have been entered as inputs on the same level. This usually requires some prior calculations of input-output quantities. If you generate a DP PPM automatically, the system creates a single-level PPM, irrespective of whether the PP-DS/SNP PPM is single-level or multi-level.
You can also use production data sources (PDS). These should have been generated for use in DP or SNP. For more details, see Working with Production Data Structures in DP.
       2.      Assign the PPM/PDS to the supply chain model you want to work with.
       3.      Assign the version you intend to work with to this supply chain model.
       4.      Create a master planning object structure and select DP BOMs relevant.
This adds the characteristics 9AMATNR, 9ABOMID, 9ABOMIO, and 9APPMNAME to the master planning object structure. You can add any other characteristics that are required.
Caution
If you assign navigational attributes to 9AMATNR, this can lead to problems in SNP.
You can however choose another characteristic to represent products. To do so, remove 9AMATNR from the structure, add the new characteristic, and choose Extras ® Assign prod./loc. You can then assign this characteristic navigational attributes and use it in SNP without problems.

       5.      Create a planning area and include in it a key figure for independent demand (finished product level) and a key figure for dependent demand (BOM level). In the key figure details:
...
                            a.      Set up the key figures for independent demand and dependent demand. 
                            b.      Set linked semantic codes for the two key figures; for example, set the Key figure semantic 401 for the independent demand key figure and 501 for the dependent demand key figure. Semantic code 401 is linked to 501, 402 is linked to 502, and so on. Use each semantic code only once for one key figure in a planning area. If you have more than one set of independent demand/dependent demand key figures in the planning area, use different semantic codes for each pair.
Note
LiveCache calculates with 3 decimal places. This means that if fractions are created during calculation of quantities, this may lead to unexpected rounding errors. For instance if the output quantity is 3 and the input quantity is 7 for one component, this corresponds to factors of 0.42857142857... or 2.33333333. You can avoid this problem by including a further pair of key figure and assigning them the key figure semantic 60x (for example 601 and 602). Internally the system then stores the nominator and denominator of the fraction, eliminating such errors. 
       6.      Create the master data for Demand Planning, the characteristic value combinations, based on the master planning object structure you created in step 4.
The field for the characteristic PPM is grayed out. The PPM information is not generated in this step.
       7.      At this stage you can also automatically generate a DP PPM. This functionm is not available for PDSs.
       8.      Add the PPM/PDS information to the DP master data by choosing the fourth option Add BOM information and specifying the version to which your PPM/PDSs are assigned.
       9.      The system reads all the characteristic value combinations and adds a PPM/PDS to the product combinations where a PPM/PDS exists.
This step generates additional characteristic value combinations for material components as entered in the BOMs.
Note
Note that in the standard system the input products must have the same free characteristics as the output product. For instance if Output Product 1 belongs to Brand A, all the input products must also belong to Brand A. You should therefore be careful when deciding which characteristics to use in the planning area. Consider using navigational attributes in cases where this could cause problems.
As of release 4.0 it is possible to change the free characteristics. To do so, implement method COMBI_ENRICH in BAdI /SAPAPO/SDP_MASTER.

   10.      Initialize the planning area and the version:
...
                            a.      From the current settings, choose Administration of Demand Planning and Supply Network Planning.
                            b.      Right mouse click the planning area you created in step 5.
                            c.      Choose Create time series objects.
                            d.      Enter the version you assigned in step 3.
                            e.      Choose Enter.
   11.      Configure the forecast settings for the planning area (right mouse click the planning area).
   12.      Design a planning book view with two grids, grid 1 for finished products and grid 2 for material components.
   13.      In interactive demand planning, plan the demand for the finished products in the upper table (this is the top grid, grid 1).
   14.      If you selected multiple products, drill to the All details level.
   15.      Choose This graphic is explained in the accompanying text in the top table to view the dependent demand in the lower table (grid2).
   16.      If necessary, rearrange the sorting order of the drill-down path in grid 2 by right mouse clicking the top left cell of grid 2 and choosing Pivot sorting. To change the sorting sequence, drag and drop.
   17.      Release demand on the finished product level to Supply Network Planning where the dependent demand will be calculated based on SNP PPMs.
In some industries, you may wish to release material component demand to SNP instead of finished product demand; this is the case where the components are the products for which actual demand will occur (see Purpose above).
In cases where a product has both independent and dependent demand (such as consumer goods that can also form part of a store display), you can use a macro to sum the two demand types before releasing to Supply Network Planning.

Subsequent Changes to PPM/PDSs

If you change a PPM/PDS after including it in characteristic value combinations, you must update this information.
·        If you have added, changed or deleted components in the PPM, you must rerun the Add BOM information as in step 8. Do not set the Use only PPM/PDS space records indicator. Set the Create time series objects indicator.
·        If you have only changed the quantities in the PPM, run the time series consistency check for the planning area (see Consistency Checks for Planning Areas). Set the Repair indicator.
End of Content Area

Thursday, November 4, 2010

Use of Descriptive Characteristics

Entering content frame  Use of Descriptive Characteristics Locate the document in its SAP Library structure

Purpose
This process describes how to set up the system so that you can use descriptive characteristics in applications such as Capable-to-Match (CTM) and Production Planning (PP).
Prerequisites
You have decided which characteristics you want to use as descriptive characteristics and which fields they should be mapped to.
Process Flow
  1. Check that the field catalog contains the fields that you need and if necessary add them. For details, see
  2. Structure linkMaintaining Field Catalogs
  3. Create a consumption group. For more details, see
  4. Consumption Group
  5. Assign the consumption group to the product master. You do this on the Demand tab page of the location-specific view. Here you also assign a proposal for the requirements strategy. Strategy 20 (Planning with final assembly) is suitable for most applications that use descriptive characteristics.
  6. In Demand Planning create a master planning object structure that contains the descriptive characteristics. See
  7. Working with Master Planning Object Structures.
  8. Continue by creating the other Demand Planning objects, such as a planning area based on the master planning object structure you created in the previous step. See
  9. Planning Area Administration.
  10. Create characteristic value combinations that include the values of the descriptive characteristics that you are expecting. See
  11. Characteristic Value Combination.
  12. Create a forecast for the product using Demand Planning functionality. For more information see
  13. Structure linkDemand Planning Process.
  14. Release the demand plan to SNP, entering the consumption group either in the release profile or the selection screen. See
  15. Structure linkCreating a Release Profile and Structure linkReleasing the Demand Plan Online.
Result
You can now work with descriptive characteristics in PP/DS and CTM.
Leaving content frame

Safety Stock Planning in CTM

Entering content frame

Function documentation Supply Control Locate the document in its SAP Library structure

Use

In CTM planning you have the choice of various functions for supply control. Supply control in Capable-to-Match (CTM) consists of functions that you can use to construct additional supply, as well as functions that you can use to restrict a receipt’s time in storage.

Features

Constructing Safety Stock
There are two methods of constructing safety stock in CTM:
·        Safety stock
The aim of this method is to build up additional supply according to the value for safety stock. The system always builds up the safety stock after CTM planning.
NoteIn demand prioritization, CTM planning treats safety stock requirements that you cause to be generated in the SAP liveCache in exactly the same way as other requirements. In the planning version, you choose Consider Safety Stock Requirements in SAP liveCache under PP/DS: Take Safety Stock Into Account. If you have selected this option and have also set the Build Up Safety Stock indicator, the system does not take account of the indicator in the CTM profile.
You can also use interval planning to plan a time-dependent safety stock, for example, that you have determined in a SNP key figure. The system builds up a safety stock after each interval. The system can then use this safety stock to fulfill the demands that fall within the next interval.
·        Safety days’ supply
The aim of this method is to hold supply to fulfill demands within the safety days’ supply figure you have specified in the location product master.
CTM uses the safety days’ supply as a safety time between the availability date of a receipt element to be created, and the requirements date of a requirement element that should be covered by the receipt element.
You can also plan a time-dependent safety days’ supply (that you have determined in a SNP key figure).
Restricting a Receipt’s Time in Storage
You can use the following methods within CTM to influence the time in storage for a receipt.
·        Maximum earliness
You can use the Maximum Earliness function to restrict the timeframe between individual receipts and requirements for a location product, and so prevent the system building up too much supply. The system must only generate a receipt to cover a requirement when the availability date for this receipt falls within a specific timeframe before the requirements date. However, the system can use existing receipts to cover the requirement.
·        Order creation frame (horizon for creating orders)
You can use the Order Creation Frame (Horizon for Creating Orders) function to restrict the processing time for a product across all BOM levels in such a way that generally, less supply is built up. If you have defined various procurement alternatives with different priorities, CTM planning usually selects the alternative with the highest priority. However, if you have entered a specific timeframe for creating orders, CTM planning can think that only an alternative with a lower priority can cover the requirement in the given timeframe. This results in a shorter timeframe between the availability date of the receipt and the due date of the requirement.

Activities

You enter the values for the safety stock, safety days’ supply, corresponding safety stock method, and the value for the maximum earliness in the location product master. In the CTM profile on the Supplies tab page, you enter the functions you want to use for supply control.
If you want the system to evaluate a SNP key figure for the safety stock, safety days’ supply, or maximum earliness, you must make the relevant settings in Supply Network Planning and in Customizing for CTM. See Setting Up SNP Key Figures for Supply Control.
You enter the value for the time period for creating orders in the location product master on the SNP 2 tab page under CTM Settings in the Order Creation Frame  field.

Entering content frame

Process documentation Setting Up SNP Key Figures for Supply Control Locate the document in its SAP Library structure

Use

If you are using a supply control method in Capable-to-Match (CTM) that determines the value from an SNP key figure, you must make the following settings. You can use SNP key figures for the methods Safety Stock, Safety Days’ Supply, and Maximum Earliness.

Prerequisite

·        In the location product master for the safety stock or safety days’ supply, you have selected the safety stock method MB, MZ, MM, AT, AS, BT, or BS.
·        In the CTM profile for Maximum Earliness you have selected the Use Value from SNP Key Figure option.

Procedure

...
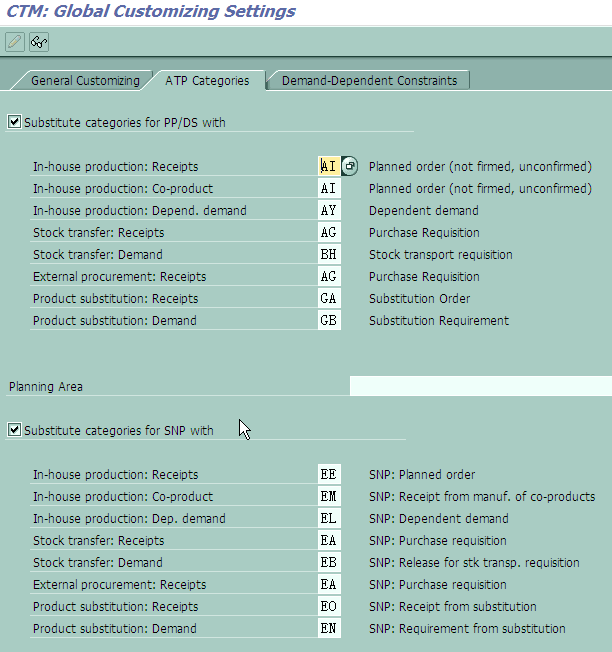
       1.      You must select a planning area that specifies where the system should save the values in the key figures. To do this, in CTM Customizing choose Maintain Global Values and Default Values, tab page ATP Category.
Note
The auxiliary key figure for safety stock in the standard planning book in Supply Network Planning is SAFETY. You can, however, create your own auxiliary key figure. If you do so, you must ensure that this key figure is included in the planning book that you are using.
You can also create an info object (which contains the safety stock key figure) in Supply Network Planning. If you do so, you must assign this key figure to the planning area that you are using.
When you create your planning area, you must also enter the value N (no time distribution) in the field Time-Based Disaggregation on the Key Figure Disaggregation tab page on the S&DP Administration screen. (From the SAP Easy Access screen, choose Supply Network Planning ® Environment ® Current Settings ® Administration of Demand Planning and Supply Network Planning). For more information on creating planning areas, see Structure linkPlanning Area Administration.
       2.      You must also make this key figure (the one you created in Supply Network Planning) available for CTM planning. In CTM Customizing, select Make SNP Key Figures Available.
Note
Always enter 9AMALO as the planning object structure for location products.

Leaving content frame

Leaving content frame

Monday, October 25, 2010

Enable SAP Gui Shortcut password field


First of all, this is not recommended. Make sure your PC is secured, and no one has access to it. Then you can try the following:

Run REGEDIT

Find
HKEY_CURRENT_USER\Software\SAP\

--> Right Click on SAP
--> Then New
--> Key with name SAPShortcut
--> Then using Same above Step create a key name "Security" under "SAPShortcut"
--> Now Right Click on the Security --> New --> String Value
--> Give Name "EnablePassword" to this and Set it Value 1

Then Close regedit and if SAP GUI open close it too
Now open SAP GUI and you will find the Password Field Enable.

Thursday, October 21, 2010

Supplier Collaboration Planning level

Strategic level:
Partners achieve mutual decisions on strategic topics, e.g. binding agreements on production capacities, joint product design, development, and long-team pricing agreements.

Tactical Level:
It might involve sharing forecasting data, production and transportation plans. It also relates to medium-team capacities, Bill of Materials and stock on hand, safety stock levels, materials availability, contacts, and etc.

Operational Level:
It involves planning in short team level, such as placing purchase orders, managing production orders, invoices, and credits.

Friday, September 17, 2010

Some questions about SNP aggregates, hierarchy, safety stock planning

1. WHY THERE'S NO 9ALO and 9AMA AGGREGATE in 9ASNP02 planning area:
Not quite sure the reason. But we can do the aggregation in hierarchy.

2. WHY SAFETY STOCK IS TIME SERIRES KEY FIUGRE
safety stock kf does not exist in 9asnp02 planning area. if you want to use this functionality, add a custom safety stock kf, assign functiona 3003(safety stock) in the planning area. Most of cases, we use time-series key figure for safety stock planning. Because planner want to control the safety stock as demand changes. So, this is a time based scenario. It makes sense to use time series key figure. We maintain the qty or day's of supply and choose the safety stock calculation method in Lot size tab in Product/Location master.

We can also use order series key figure if only thing you want to do is to display safety stock as an order. You can barely do any planning on that.

3. check if there's any client implemented 9ARE aggreate, and the difference from resourse hierarchy.
On the functionality perspective, there's not much difference. Both function the same. Hierarchy has been used more often. Not many clients use 9ARE aggregate.

Maybe this has nothing to do with calculation levels. But more on data extraction reason. If we don't have this aggregate, and assign KF to it. We can't extact SNP data for it. So, you need to make sure if you want to extract SNP data in that aggregate level, you need to create them and assign KF to that aggregate.

4.check the following info how to maintain proportional factor manually

Manual Modification of the Proportional Factors Locate the document in its SAP Library structure

Use

There are several reasons why you might maintain the proportional factors manually, for instance:

· You wish to revise the constant proportional factors you generated automatically; for example, to account for the sporadic demand of one product.

· You wish to enter the factors manually because you have no historical data on which to base the automatic generation process.

Prerequisites

...

1. If you wish to use this function to change the automatically generated constant proportional factors, you have already generated the factors.

2. When creating the planning book, you selected Manual proportions maintenance. This indicator is to be found on the Planning book tab under Include standard functions.

3. In the planning book, you have created a data view containing only the key figure APODPDANT. (This is not absolutely necessary, but enables you to restrict the number of people permitted to change the proportional factors)

4. If necessary, you have assigned this planning book and data view to the demand planners who have the authority to change the proportional factors.

Activities

...

1. In interactive demand planning, the demand planner with the change authority opens the data view you created as a prerequisite.

2. Make a selection, for example, brand X.

3. In the header toolbar, choose Details for the characteristic you want to use as the detailed level. You now see, for example, all the products that belong to brand X.

4. In the workspace toolbar choose This graphic is explained in the accompanying text with the quick info text Absolute <=> Percentage.

The proportional factors are displayed as percentages. The sum of the details is automatically fixed.

5. Edit the proportional factors of the details as necessary.

6. Save the data.

Note

If you wish to switch from an absolute to a percentage view for a key figure in order to change the key figure values, you must define this key figure as fixable. By choosing the This graphic is explained in the accompanying text icon with the quick info text Absolute <=> Percentage you automatically fix the aggregate (sum) level. For more information on how to fix a key figure, see Structure linkFixing Key Figure Values.

Copying Proportional Factors to Other Time Buckets

When manually editing proportional factors you can copy values from one time bucket to another.

...

1. Switch to the percentage view by choosing This graphic is explained in the accompanying text.

2. Select the detail values to be copied. You must leave at least one value unselected. The system automatically calculates this value so that the total is 100%. Choose This graphic is explained in the accompanying text with the quick info text Percentage values: Copy.

3. Goto to the target area and select the same detail values. Choose This graphic is explained in the accompanying text with the quick info text Percentage values: Insert. The data is copied.

You can also use the cut/copy and paste in interactive planning to copy data. For more information, see Structure linkFunctions in Interactive Demand Planning.